
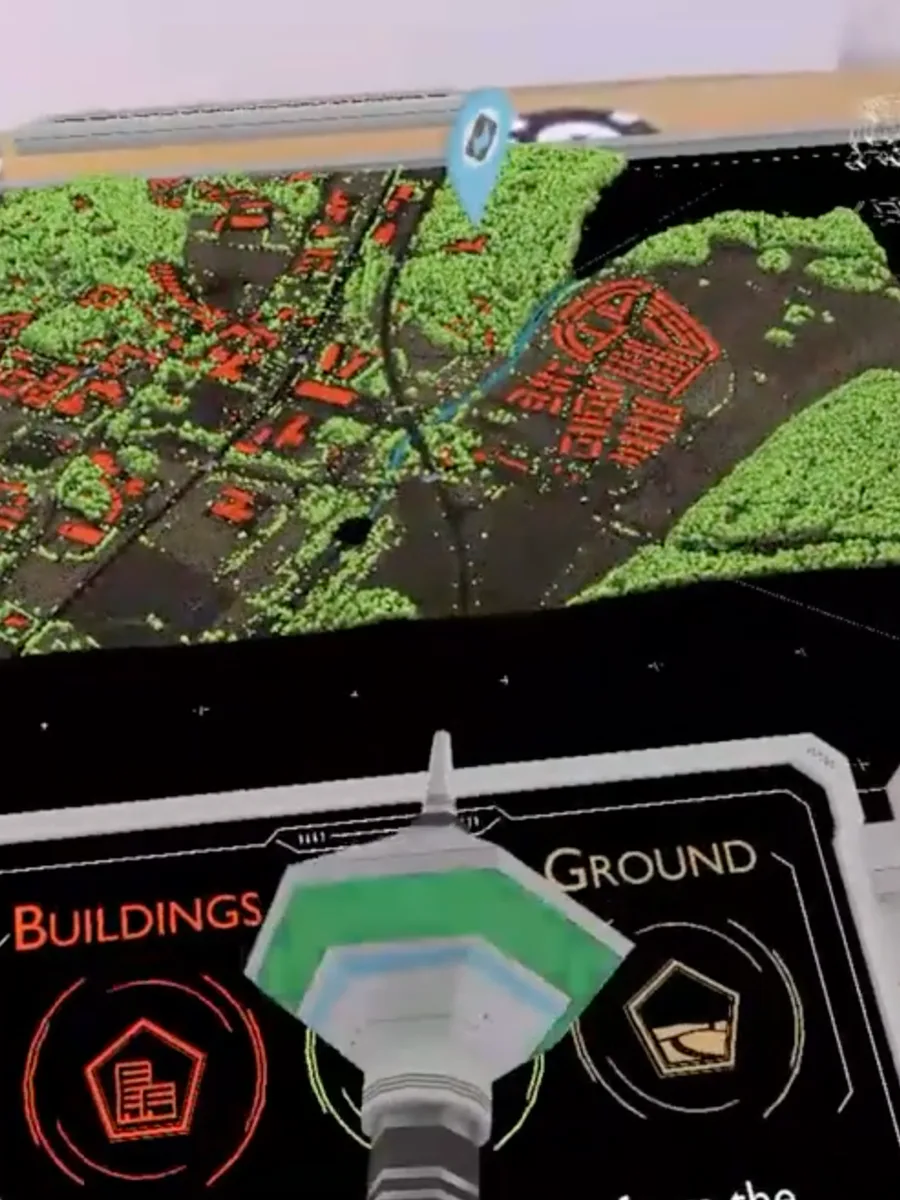
Laser-scanned forest data becomes a layered hologram

FGI · point-cloud hologram

For the Finnish Geospatial Research Institute, flyAR created an interactive point-cloud visualization showing how laser-scan data can be automatically classified into layers such as tree canopy, roads, and buildings.

Client
Finnish Geospatial Research Institute
Sector
Research
Year
2019
Service
Construction marcom & spatial viz
Delivery
Browser · QR
FGI · point-cloud hologram · case reel

01 · Problem

Problem

Point-cloud classification is powerful, but difficult to explain from raw data or flat diagrams to event audiences.

02 · Approach

Approach

We presented the classified forest-area dataset on a sci-fi hologram table and let users toggle layers on and off to see what each classification meant.

03 · Outcome

Outcome

  • Laser-scan data became visually legible to non-specialist audiences.
  • Layer toggles made classification understandable through interaction.
  • The hologram-table framing made the data feel like an exhibit, not a file.

/Inputs we worked from

  • Point-cloud dataset
  • Automatic classification layers
  • Forest and building scan data

/Audiences

  • Event visitors
  • Research stakeholders
  • Geospatial audiences

/Deliverables

  • Interactive point-cloud visualization
  • Layer toggles
  • Hologram-table scene

/Service used

Construction marcom & spatial viz

Turn drawings, BIM, and renders into experiences buyers, residents, and approvers can open and explore.

Worth knowing before you write a brief

AppsFlyer's 2025 benchmark across 28 billion installs puts Day-1 retention at around 25%. AR apps sit below that floor, because every reviewer is a single-use case, not a habit. WebAR removes the funnel. The link that opened the experience the first time still opens it the second.

Source: AppsFlyer 2025 · Adjust 2026

Read what installs cost an AR campaign